Prospector: NYC
ODCV Opportunities
$17.7M
Year One Savings
32
Buildings facing 2026 LL97 Penalties
470
Buildings with BMS
Top Portfolios
 Vornado Realty Trust
37 buildings • $1.1M savings
Vornado Realty Trust
37 buildings • $1.1M savings
 SL Green Realty
26 buildings • $1.7M savings
SL Green Realty
26 buildings • $1.7M savings
 Kaufman Organization
23 buildings • $0.0M savings
Kaufman Organization
23 buildings • $0.0M savings
Office Occupancy Recovery ▼
NYC: 76%
US Avg: 66%
SF: 47%
Behind the Rankings ▼
Rankings combine sales readiness, technical fit, and projected savings. Every building is scored out of 110 points — 100 core points plus 10 extra-credit bonus points:
Core Scoring – 100 points
- Financial Impact (40 pts) – Modeled ODCV annual savings plus Local Law 97 penalty avoidance.
- BMS Infrastructure (30 pts) – No BMS = 0 points (major barrier); with BMS = 15 base points, plus heating and cooling automation bonuses, and recency bonus for alterations.
- Owner Portfolio (20 pts) – Larger portfolios score higher because one pitch can land multiple buildings.
- Implementation Ease (10 pts) – Fewer tenants and larger floor plates score higher for simpler installation.
Extra Credit – 10 points
- Prestige Factors (10 pts) – LEED certification, ENERGY STAR improvement potential, and Class A designation.
Example: A building with $1.4M in savings but no BMS ranks #123, while a $539K building with perfect infrastructure, strong ownership portfolio, and easy install potential ranks #1. The scoring favors targets that are financially attractive, technically ready, and operationally easy to close.
Showing 5 of 5 buildings
| Image | Rank ↕ | Building ↕ | Owner ↕ | Manager ↕ | Anchor Tenant ↕ | Savings ↕ | Score ↕ | Details |
|---|---|---|---|---|---|---|---|---|
|
#1 | 141-157 W 42 St | Durst Organization | Durst Organization | TikTok | $554,335 | 98.0 | → |
|
#3 | 1507-1521 Broadway | SL Green Realty | SL Green Realty | Paramount Global | $651,112 | 96.7 | → |
|
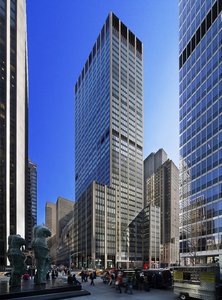
#4 | 1290 Ave Of The Americas | Vornado Realty Trust | Cushman & Wakefield | King & Spalding | $1,090,509 | 96.6 | → |
|
#5 | 482-496 Lexington Ave | SL Green Realty | SL Green Realty | Société Générale | $782,678 | 95.9 | → |
|
#121 | 111 E 58 St | Jack Resnick & Sons | Jack Resnick & Sons | Parkinson’s Wellness Foundation | $169,511 | 75.0 | → |